"Gödel, Escher, Bach": Wondrousness in Python
While perusing a bookstore a couple years ago, I stumbled upon a fascinating book by Douglas Hofstadter called Godel, Escher, Bach. If you like math, biology, music, art, computer science, and philosophy, this is really an amazing read (though, admittedly, I've only gotten halfway through since I bought the thing).
In one of the book's entertaining conversations between Achilles and the Tortoise (this conversation regarding number theory), the Tortoise tells Achilles about a number property that he calls Wondrousness. A number is found to be Wondrous if, when following a specific algorithm (below), you can turn that number into 1. That number is Unwonderous if you can't reach 1. The point of the characters' ensuing discussion is that there is no "terminating test" for the property of Wondrousness; you could never know for sure that a number is Unwonderous because you have no idea how long it would take to reach 1 if it was, in fact, Wondrous instead.
The algorithm in question is this: Take a number N. If that number is odd, take it times 3 and add 1. If that number is instead even, divide it by 2. Continue this process until N is 1.
The point, for this post, is that Achilles and the Tortoise demonstrate the above algorithm on the number 15, finding that it takes 17 steps to get to a value of 1. The Tortoise then warns that trying the same with the number 27 will require a large sheet of paper, but otherwise no more examples are given. So, I thought it would be an interesting exercise to write a short Python script to run the algorithm on a large set of numbers, and then plot the number of steps taken to get to 1 for each number.
The Python script I put together looks like this:
def is_even( num ):
    """Return True if num is even, else return False."""
    if num % 2 == 0: return True
    else: return False

def wonder( num ):
    """Return the number of Wondrous steps to get to 1"""
    num, count = int(num), 0
    while num != 1:       # stop looping once num == 1
        count += 1
        if is_even(num): num /= 2
        else: num = (3 * num) + 1
    return count

def main():
    with open(input('Save as: '),'w') as save:
        save.write('N\tSteps\n')  # column headings
        for i in range(1,int('Test Wondrousness of number 1-')+1,1):
            save.write(str(i)+'\t'+str(wonder(i))+'\n')
        print('Completed.')

main()
I ran this with values up to 1 million and it only took a few minutes to generate the file, though I'll warn you that actually plotting that many datapoints may cause your computer all kinds of problems. Perhaps start with 10 thousand (I used 100 thousand in the plot below).
For the sake of this post, I'll say that the Save Name that you gave was wondrous_nums.txt. I suspect that most spreadsheet software can't handle columns with a million entries, so I'm going to plot this dataset in R.
You only need a few R commands at this point (you can just copy-paste them in):
data = read.table( 'wondrous_nums.txt', header=TRUE )

pdf( 'wondrous_nums_plot.pdf', width=6, height=5)
plot( data$N, data$Steps, main='Wondrousness',
ylab='Steps Taken', xlab='Input Value', pch=20, cex=.3)

dev.off() #closes the pdf file you made
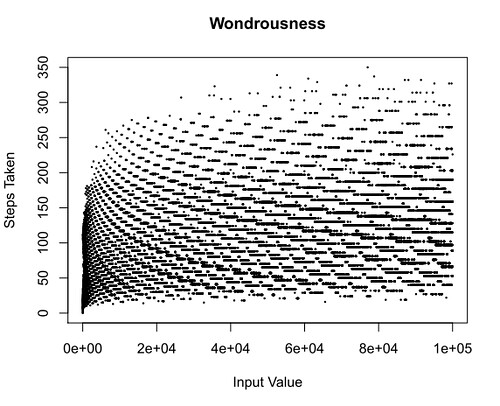
That pdf( blah blah) line makes R save to a pdf file. Below is the plot generated by these R lines, with a dataset of 100,000 points:
There's clearly some sort of a pattern there...